From Field Data to Decision Intelligence How Utilities Turn Inspection into Action
< Back to Articles & Case Studies
Utilities are not short on data. UAV inspections, handheld surveys, robotics, and fixed monitoring systems continuously generate large volumes of visual, UV, and thermal information.
The challenge is not collecting data, it’s turning it into decisions.
Most utilities still operate in a fragmented setup: data is stored across multiple systems, teams follow different methodologies, and there is limited ability to compare results over time. While detection capabilities have improved significantly, decision-making often remains inconsistent.
The shift taking place is not driven by better sensors alone, but by how inspection data is structured, analyzed, and connected to operational workflows.
A Structured Workflow for Decision-Making
The transformation from inspection data to maintenance action follows a structured process:
Capture → Analyze → Prioritize → Act → Closing the Loop
While this workflow is conceptually simple, in practice it only delivers value when it is standardized, connected, and continuously updated.
From Technology to Decision-Making
Inspection technologies have advanced significantly, but technology alone does not drive better outcomes.
The real transformation comes from how inspection data is structured, analyzed, and connected to decisions.
By implementing a structured workflow supported by platforms like Gridnostic, utilities can move from:
- Data collection → Decision intelligence
- Reactive maintenance → Condition-based strategies
- Fragmented insights → A unified and scalable operational approach
This shift enables more consistent decisions, better resource allocation, and improved long-term asset reliability.
Capture – Standardization at the Source
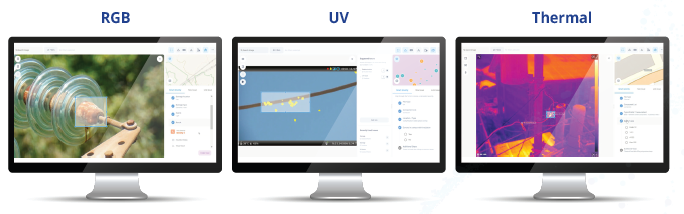
Modern inspections rely on multiple sensor types:
- RGB imaging for visual context and documentation.
- UV imaging for corona partial discharge detection.
- Thermal imaging for identifying heat-related degradation.
These technologies are deployed across drones, handheld systems, robotics, and fixed monitoring installations, often by different teams and under varying conditions.
Challenge
- Data cannot be consistently compared across time or inspection campaigns.
- Metadata such as asset ID, location, and operating conditions is incomplete or inconsistent.
- Data collected from different platforms lacks a unified structure.
- Valuable inspection data becomes difficult to reuse for long-term analysis.
Gridnostic Solution
- Standardized data collection aligned with frameworks such as IEEE 1808, ensuring consistency in how inspection data is structured and stored.
- Unified metadata model linking every inspection to specific assets, locations, and operational context.
- Integration of data from multiple inspection platforms into a single environment.
Outcome
Inspection data becomes structured, consistent, and comparable over time, forming a reliable foundation for analysis and decision-making.
Analyze – From Interpretation to Intelligence
Once data is collected, the next challenge is interpretation.
Traditionally, inspection analysis has been performed manually, relying heavily on the experience and judgment of individual inspectors. While effective, this approach introduces variability and limits scalability.
Challenge
- Subjective evaluation of findings
- Variability between inspectors and teams.
- Difficulty maintaining consistency across large datasets.
- Time-consuming review processes for large inspection campaigns.
Gridnostic Solution
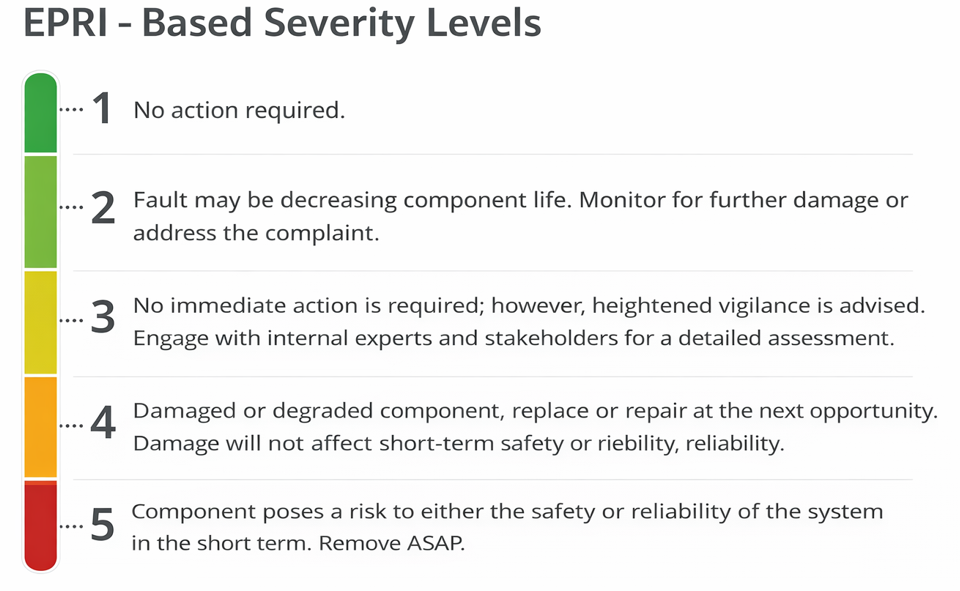
- Severity diagnostics aligned with EPRI guidelines, providing a structured and consistent approach to evaluating findings.
- Cross-sensor correlation between UV, IR, and visual imagery to provide a more. complete understanding of asset condition.
- AI-assisted detection of components and defects in visual and thermal imagery, supporting faster and more consistent analysis.
- Normalized evaluation workflows across teams and inspection types.
Outcome
Analysis moves from isolated observations to consistent, contextualized insights – from “what we see” to “what it means.”
Prioritize – Turning Findings into Decisions
Inspection campaigns often generate large volumes of findings, while maintenance resources remain limited.
The challenge is not identifying issues, but determining which ones require immediate action.
Challenge
- High volume of findings with limited capacity to address them.
- Lack of a consistent framework for prioritization.
- Decisions driven by individual judgment rather than structured criteria.
- Difficulty balancing asset condition with operational risk.
Gridnostic Solution
- Severity scoring based on two key dimensions:
- Component condition derived from inspection data and analysis.
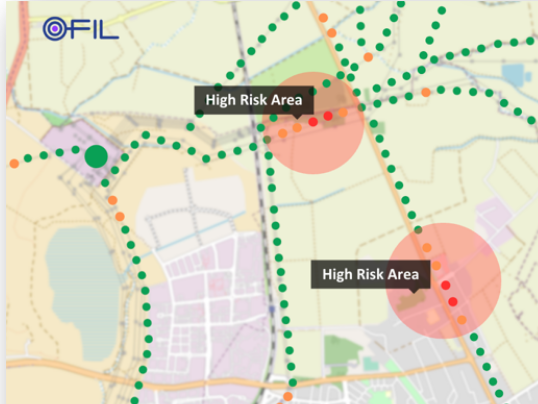
- Asset risk and impact based on criticality, environmental context, and operational importance.
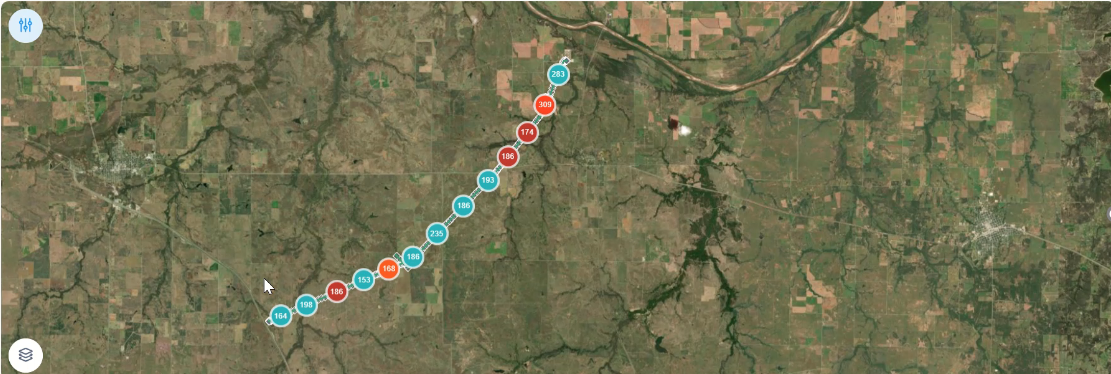
- Integration of inspection results with GIS and asset data to provide full operational context.
- Structured prioritization across all findings, enabling consistent comparison
Outcome
Utilities gain clear visibility into what should be addressed first, and why, enabling a shift toward condition-based maintenance.
Act – From Insight to Execution
The value of inspection data is only realized when it leads to effective action.
Even when issues are identified and prioritized, translating insights into operational decisions can remain a challenge.
Challenge
- Insights remain within reports without clear linkage to execution.
- Maintenance actions are not always aligned with actual risk levels.
- Inefficient allocation of crews and resources.
- Difficulty coordinating actions across teams and regions.
Gridnostic Solution
- Structured reporting that connects findings, severity, and recommended actions.
- Centralized database of historical inspection data for reference and validation.
- Risk-based prioritization integrated into operational workflows.
Outcome
Inspection results translate into targeted, efficient maintenance actions, reducing unnecessary work while addressing critical issues in a timely manner.
Closing the Loop – Continuous Intelligence
The most advanced utilities treat inspections as part of an ongoing process rather than isolated events.
They build a continuous feedback loop between inspection, analysis, and maintenance.
Challenge
- Inspection data is not fully utilized beyond initial analysis.
- Limited visibility into long-term trends and recurring issues.
- No systematic feedback between maintenance outcomes and future inspections.
- Difficulty tracking asset condition over time.
Gridnostic Solution
- Long-term asset monitoring with centralized data storage.
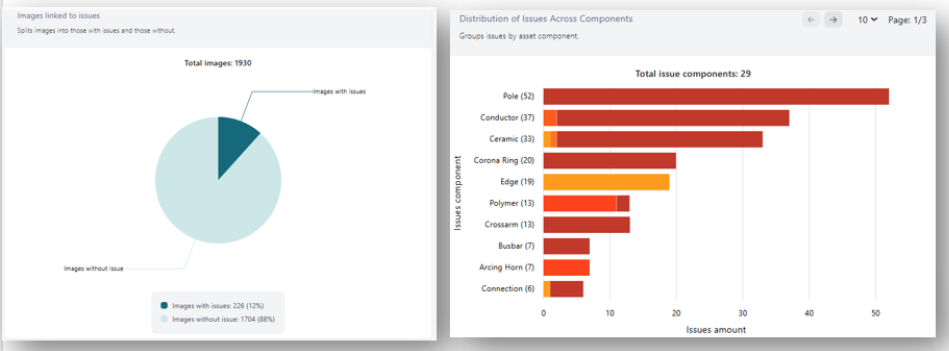
- Dashboards and visualization tools to track trends and performance over time.
- Continuous integration of inspection data with maintenance outcomes.
Outcome
Utilities move from one-time inspections to continuous, data-driven asset intelligence, enabling more proactive and informed decision-making.