
Diagnostics Capabilities
Our platform converts complex imagery data into clear numeric severity scores, delivering actionable insights for efficient asset health management.

Multi-Sensor Integration
Leverage multi-sensor technology including UV, RGB and Thermal to enhance analysis capabilities.

GIS-Enhanced Platform
Integrates all inspection data within a geospatial context, offering a strategic, map-based overview of grid health. Built for drone and UAV inspection workflows, Gridnostic processes drone imagery, orthomosaics, and video from DJI and other platforms, alongside helicopter, fixed-wing, and ground inspection data, all within a unified GIS-based platform.

Simplifying Complexity – AI Enabled
Transform complex data into clear, actionable insights with AI models enhancing data interpretation.

Asset-Based Data Management & Reporting
Efficiently manage historical data and enhance communication with sharing and reporting capabilities

Expert Advice & Diagnostics
Backed by years of industry knowledge, receive expert advice and diagnostics to solve problems faster.


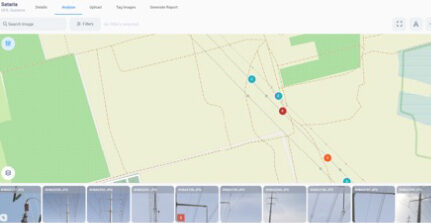
Map Display
Pictures are color-coded according to their severity levels, allowing for quick visual assessment of priority areas in T&D networks and substations.

Analysis Interface
Comprehensive interface for analyzing the inspection data.
Asset Overview
Dashboard that offers a comprehensive view of all electrical assets and their health levels.

Severity Diagnostic Tool
Dynamic, interactive evaluation interface that guides the determination of numerical severity scores.