Infrared Imaging Camera and Infrared Detection Camera vs UV Imaging in High-Voltage Systems
Infrared imaging cameras and infrared detection cameras identify heat-related electrical faults, while UV imaging detects voltage-related discharge activity. Each technology reveals different physical mechanisms across the failure curve in high-voltage systems.
Scope
- What an infrared imaging camera is and how it works
- How an infrared detection camera identifies heat-related faults
- How UV imaging detects corona partial discharge
- Recommended conditions for thermal and UV inspection
- How failure mechanisms become visible to each technology
- Field examples showing UV-only, thermal-only, and combined findings
- Why RGB, UV, and thermal inspection are complementary
On this page
UV vs Infrared Imaging: Key Differences
Because ultraviolet and thermal technologies respond to different physical triggers, they reveal different dimensions of equipment condition. RGB visual inspection adds contextual information by documenting physical damage, mechanical defects, installation irregularities, and contamination, which supports interpretation and reporting within a comprehensive inspection workflow.
What is an infrared imaging camera?
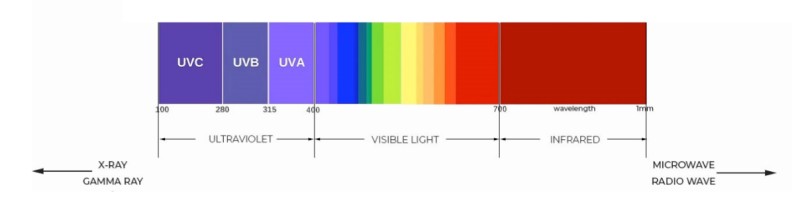
An infrared imaging camera operates in the infrared region of the electromagnetic spectrum. Most inspection systems detect radiation in the long-wave infrared band, between 7 and 14 micrometers. This region lies beyond visible light and is associated with thermal emission.
All objects above absolute zero emit electromagnetic radiation as a function of temperature. In electrical equipment, this radiation increases when localized heating occurs. Thermal cameras measure this emitted energy and convert it into a temperature-mapped image.
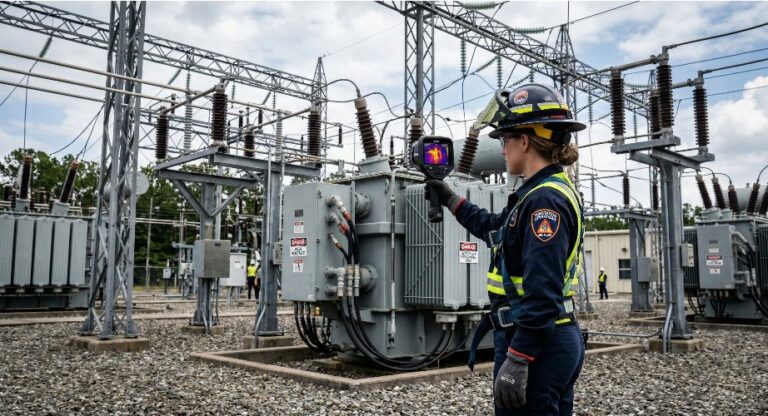
What an infrared detection camera identifies in electrical systems
Thermal imaging identifies temperature rise associated with current flow and resistive losses. Thermal cameras are particularly effective at identifying faults that have progressed to a stage where energy loss is occurring in the form of heat.
- Operates in the infrared region of the spectrum
- Measures emitted energy and converts it into a temperature-mapped image
- Reveals heat-related electrical inefficiency
- Detects localized temperature rise and hotspots
- Identifies resistive heating under load
- Used here as a thermal inspection tool description
- Detects heat, not electric field stress
- Shows the thermal consequence of electrical inefficiency
- Does not measure voltage stress or electric field concentration
Detects
Resistive heating, overload, and localized temperature rise.
Primary driver
Current flow through an area of elevated resistance.
Typical stage
Mid to late-stage degradation where energy loss is visible as heat.
How thermal anomalies form in electrical systems
Thermal anomalies in electrical infrastructure arise when electrical energy is unintentionally converted into heat. This typically occurs when resistance increases at a conductive interface or within a component operating under load.
Common causes of thermal anomalies seen by an infrared imaging camera
- Loose or improperly torqued connections
- Degraded compression joints
- Overloaded components
- Phase imbalance
- Internal component deterioration
When current flows through an area of elevated resistance, localized heating develops. If the temperature of that region rises measurably above similar components operating under comparable conditions, the thermal camera detects the differential and displays it as a hotspot.
Key thermal limitation: heat generation depends on current magnitude. Without sufficient load, even a defective connection may not produce a detectable temperature rise.
An important distinction: thermal cameras do not measure voltage stress or electric field concentration. They detect emitted infrared radiation associated with surface temperature. The anomaly observed is the thermal consequence of electrical inefficiency, not the underlying electric field behavior itself.
Recommended inspection conditions for reliable thermal measurement
Accurate interpretation of thermal anomalies depends not only on camera capability, but also on inspection conditions. Meaningful thermal results require controlled and well-documented operating conditions.
Load conditions
Line loading should typically be at least 40% of the rated maximum electrical load.
Comparative evaluation
Thermal performance should be evaluated comparatively rather than by absolute temperature alone.
Environmental controls
Wind, solar radiation, and ambient temperature must be considered during inspection.
- Wind should be minimized because forced convective cooling can suppress apparent temperature rise.
- Solar radiation must be considered because direct sunlight can create apparent hotspots unrelated to electrical stress.
- Ambient temperature should be recorded because temperature rise above ambient is often more meaningful than absolute surface temperature.
- Proper line-of-sight, focus, distance, temperature range, and scaling are required to avoid distorted thermal gradients.
In short, an infrared imaging camera is effective for heat-related faults, but the reliability of findings depends heavily on load and environmental conditions.
How UV imaging works in high-voltage inspection
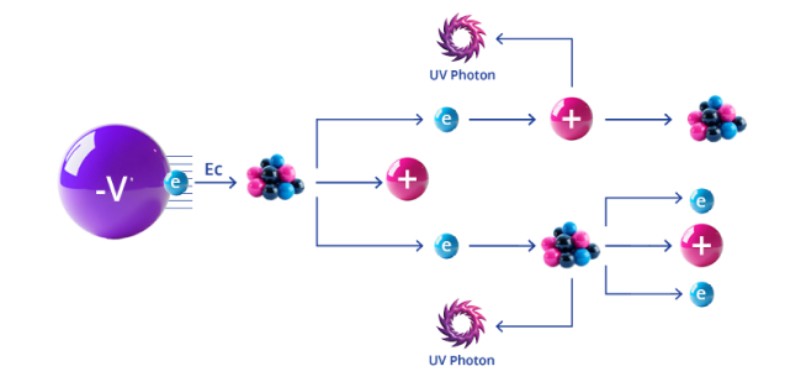
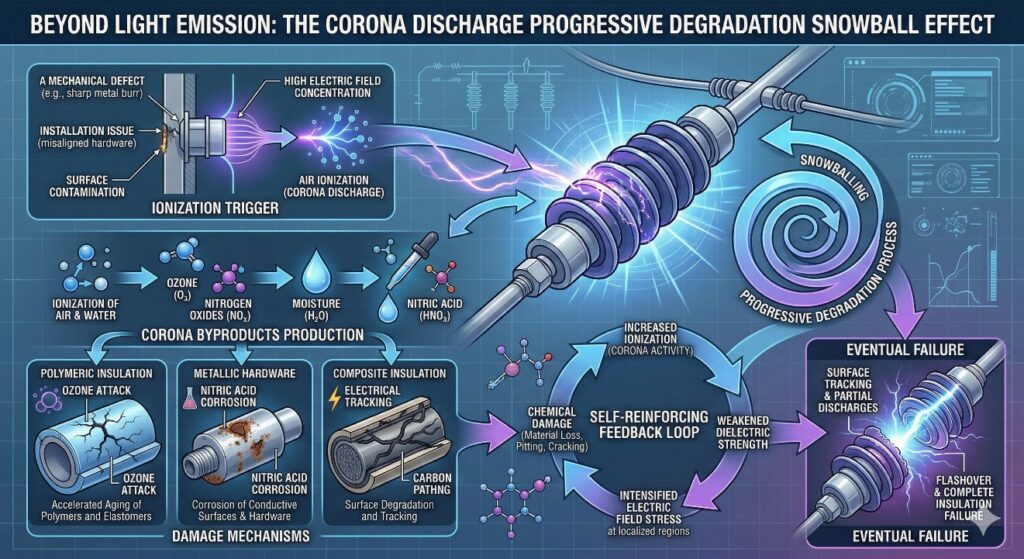
Ultraviolet inspection is based on a fundamentally different physical mechanism than thermal imaging. Instead of measuring heat, UV systems detect light emitted during air ionization caused by high electric field intensity.
When the electric field surrounding an energized conductor exceeds the dielectric strength of air at localized regions, the surrounding air molecules become ionized. This phenomenon, commonly referred to as corona partial discharge, results in the emission of electromagnetic radiation primarily in the ultraviolet range.
Why solar-blind UV is important
Corona partial discharge light emission occurs broadly within the UVA, UVB, and UVC regions. However, sunlight also contains significant ultraviolet radiation within the UVA and UVB bands. To enable reliable daylight inspection, solar-blind UV cameras operate within the UVC band, where atmospheric ozone absorbs solar radiation before it reaches the Earth’s surface. As a result, the background solar UV level in the UVC range is extremely low, allowing corona discharge to be detected with high contrast even under full daylight conditions.
What UV discharge means physically
Corona represents more than a visual phenomenon. Ionization of air generates ozone and nitrogen oxides, which can combine with moisture to form nitric acid. These compounds attack surrounding materials, accelerate aging of polymeric insulation, promote corrosion of metallic hardware, and reduce dielectric strength over time.
High electric field concentration due to a mechanical defect, installation issue, or contamination leads to ionization. Ionization produces chemical damage. Chemical damage further weakens materials and can intensify electric field stress at localized regions. The process can become self-reinforcing.
What causes voltage-driven anomalies
- Mechanical damage such as cracked insulators or broken conductor strands
- Improper installation, loose components, or incorrect hardware geometry
- Surface contamination from salt, dust, or industrial pollution
- Loss of hydrophobic properties in polymer insulators
- Erosion of insulating cement in porcelain insulators
- Absence or improper placement of corona rings
- Corroded end fittings and metallic accessories
- Bird-cage deformation of stranded conductors
- Sharp edges or improper conductor spacing

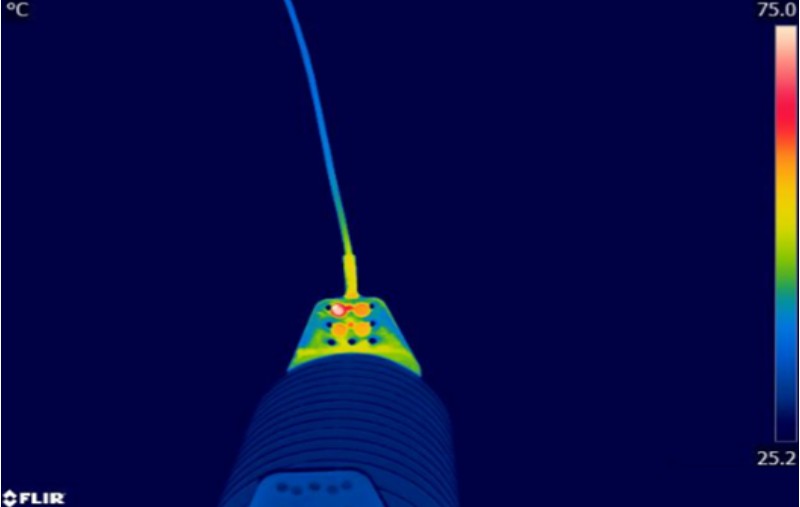
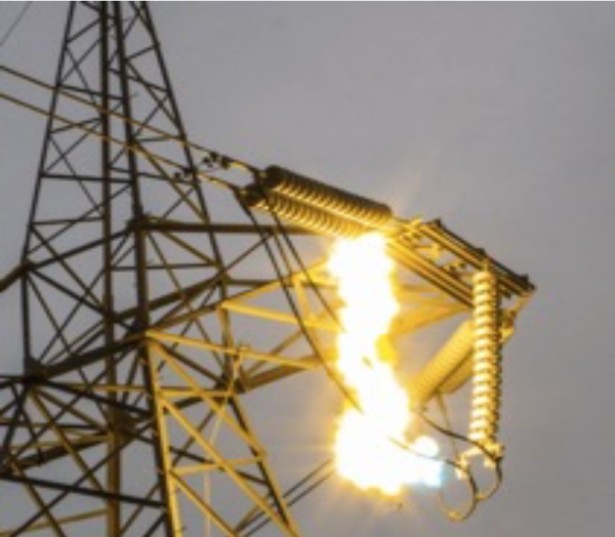
Corona discharge activity
on HV insulator detected
using a UV camera
Recommended inspection conditions for reliable UV detection
Unlike thermal measurements, which are strongly dependent on load current, corona activity is governed primarily by electric field intensity.
Load dependence
Corona can be present even under no-load or light-load conditions because significant current flow is not required for discharge activity to occur.
Humidity effect
Increased humidity can enhance corona visibility by lowering the breakdown strength of air and promoting ionization.
As with all optical inspection methods, proper line-of-sight, focus, and distance are essential. Discharge intensity decreases with distance, and imaging parameters must be selected to ensure accurate representation of activity.
Electrical failure mechanisms and diagnostic visibility
Electrical degradation in high-voltage systems does not progress along a single path. Depending on the initiating condition, a defect may first manifest as abnormal electric field behavior, as resistive heating, or as a combination of both.
Field-driven defects
Field-driven defects disturb the intended electric stress distribution of a component. These conditions may remain thermally invisible, particularly under light load, yet still indicate deteriorating insulation performance or geometric irregularities.
Resistive defects
Resistive defects develop within the current-carrying path. Elevated resistance under load leads to localized heating that becomes detectable through infrared imaging. In these cases, the dominant symptom is energy dissipation in the form of heat rather than discharge activity.
Electrical failure
Overlapping mechanisms
As degradation progresses, mechanisms can overlap. A component experiencing prolonged discharge may eventually develop resistive tracking and begin to generate measurable heat. Conversely, a resistive defect may alter geometry or material condition in ways that intensify local electric field stress.
Practical interpretation and correlation
What UV findings usually mean in the field
The presence of corona discharge indicates localized electric field concentration. It does not automatically mean imminent failure, but it does signal abnormal electrical stress that warrants evaluation.
Interpreting UV findings requires considering the type, material, and geometry of the component, the exact location of the discharge, system voltage level, criticality of the asset, historical inspection data, observable visual indicators, and environmental conditions such as humidity, contamination, and pollution level.
For example, discharge at sharp hardware edges may reflect geometric field concentration. Discharge along an insulator surface may suggest mechanical defects, contamination, or loss of hydrophobicity. Activity at end fittings may indicate corrosion or improper grading.
What thermal findings usually mean in the field
Thermal anomalies represent measurable temperature rise relative to comparable components operating under similar conditions, or over ambient temperature. Interpretation should be based on relative comparison rather than absolute temperature alone.
Key considerations include comparison with adjacent phases or similar components, load magnitude at time of inspection, ambient temperature, and surface emissivity characteristics. Inspectors must also account for solar reflections, low-emissivity metallic surfaces, viewing angle, focus, and measurement scale.
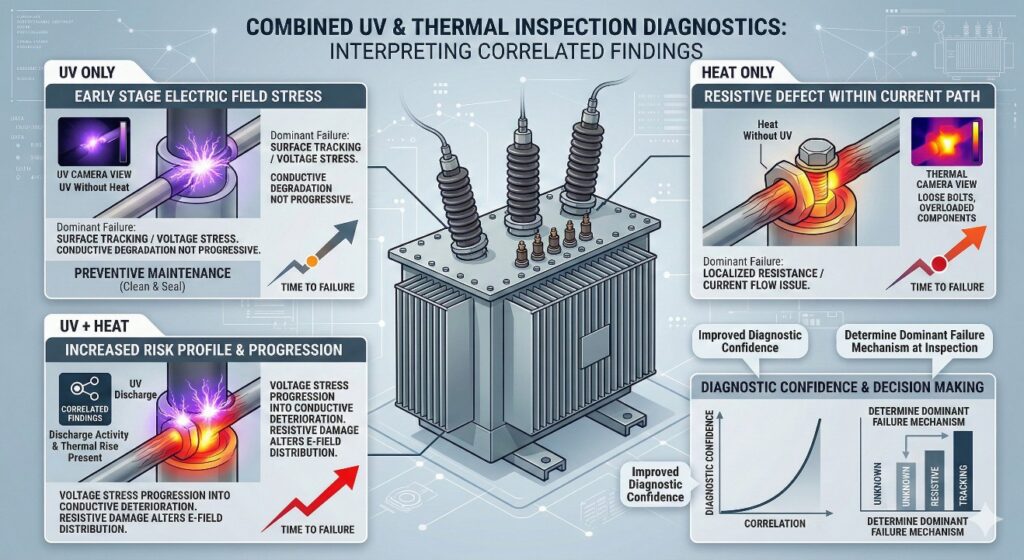
Why correlation matters
- UV without heat often indicates early-stage electric field stress before conductive degradation has progressed.
- Heat without UV typically indicates a primarily resistive defect within the current path.
- When both discharge activity and thermal rise are present at the same location, the risk profile increases.
Correlation improves diagnostic confidence and helps determine the dominant failure mechanism at the time of inspection.
Field examples: UV vs thermal in practice
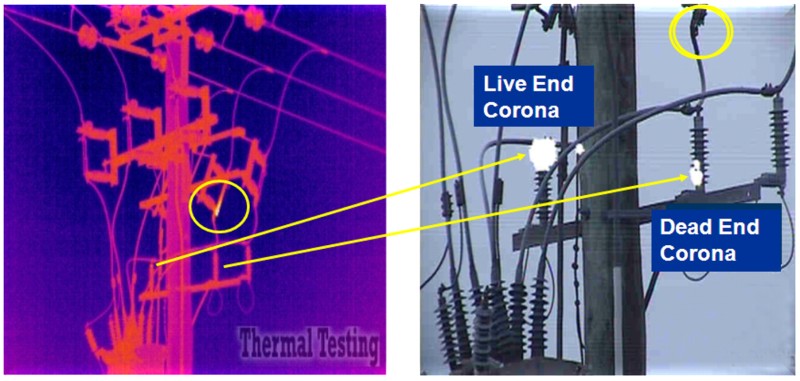
Distribution pole inspection
In the distribution pole example, ultraviolet imaging identified two distinct corona discharge locations associated with insulators. One discharge was at the live end of the insulator, and the second was at the dead end. The dead-end activity was more critical because that location is intended to isolate the energized conductor from the pole structure.
The corresponding thermal image showed no measurable hotspot at either discharge location, which indicated that the corona activity was voltage-driven and had not yet progressed to a stage where resistive heating was present.
However, the thermal image did reveal a separate hotspot at a compression connector. No ultraviolet discharge was observed there. This suggested a resistive defect in the current-carrying path, likely caused by improper compression, mechanical loosening, or contact degradation.
Detected by UV but not thermal
Voltage-driven corona activity on insulators.
Detected by thermal but not UV
Current-driven resistive heating at a connector.
As with all optical inspection methods, proper line-of-sight, focus, and distance are essential. Discharge intensity decreases with distance, and imaging parameters must be selected to ensure accurate representation of activity.
Multi-Spectral Inspection of a Distribution Pole Using UV and Thermal Cameras
Substation inspection using DJI M300 drone
In the substation example, a DJI M300 drone equipped with both UV and thermal cameras detected two thermal hotspots on a high-voltage bushing and simultaneous ultraviolet discharge activity at the same location. The combined finding indicated overlapping degradation mechanisms rather than a purely voltage-driven or purely resistive issue.
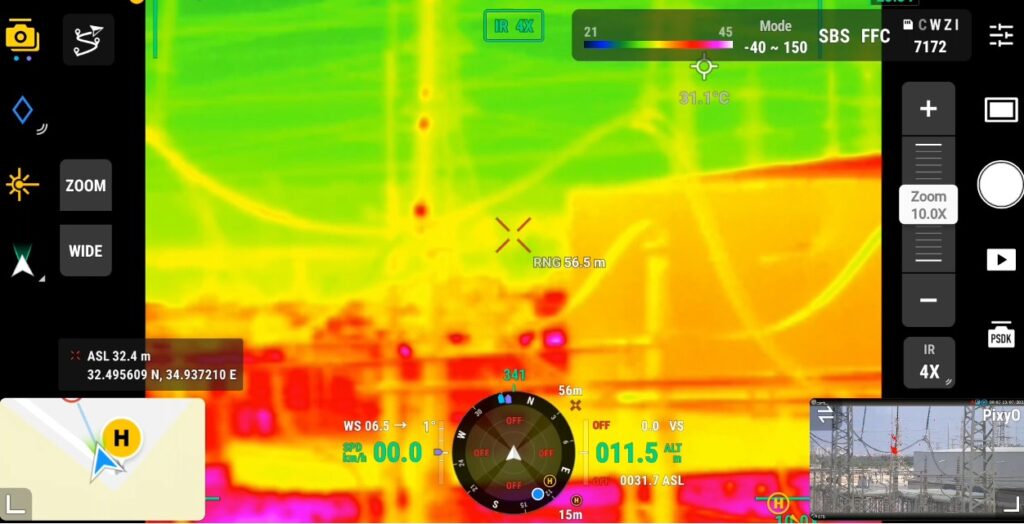
Hotspots and corona discharges detected on a high voltage bushing
Ceramic insulator inspection
In the ceramic insulator example, the RGB image showed no visible signs of mechanical damage, cracking, contamination, or structural irregularities. The thermal image also revealed no measurable temperature rise. However, ultraviolet imaging identified discharge activity at two locations between the insulator disc and the metal cap.
This type of discharge suggests localized electric field concentration and may indicate a small air gap, improper seating during installation, cement degradation, or loss of internal bonding. The key point is that the defect was not mechanically visible and had not progressed to resistive heating. It was detectable only through ultraviolet imaging.
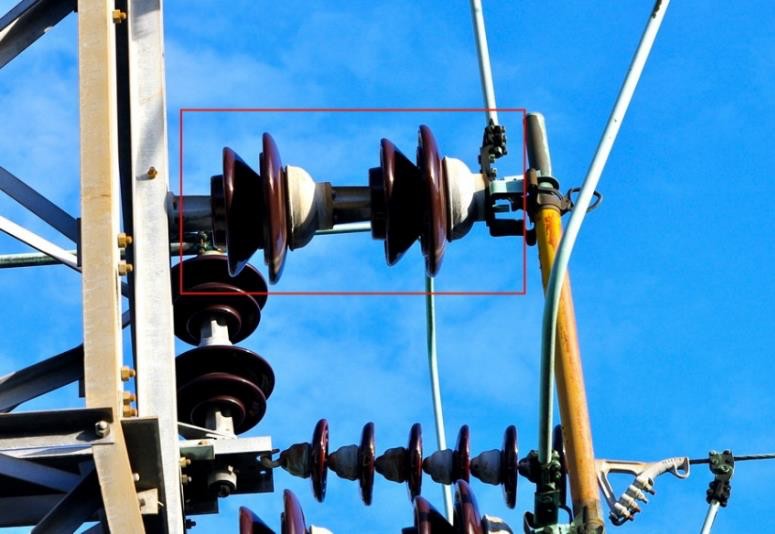
Visible (RGB) image of ceramic insulator
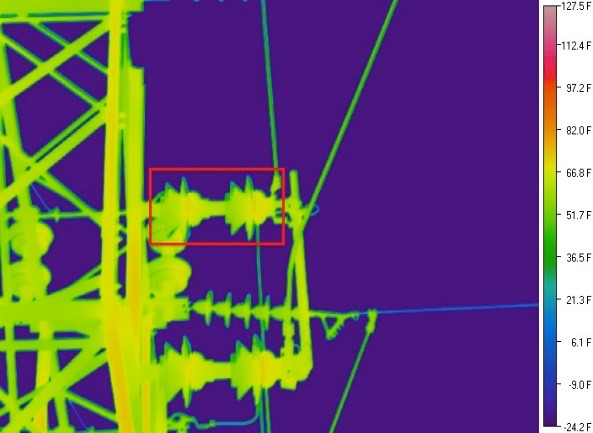
Thermal image: no anomaly detected
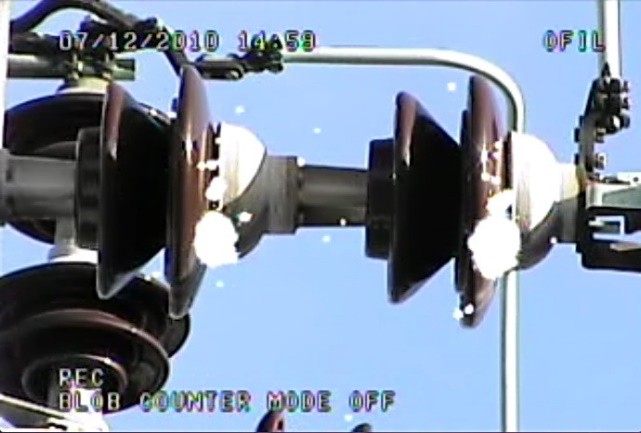
UV image: two spots of corona discharge detected
Multi-spectral inspection workflow
Effective inspection programs integrate multiple detection domains to capture different aspects of asset condition. Ultraviolet and thermal imaging address electrical behavior, while RGB imaging provides physical context.
Why RGB still matters
RGB visual inspection does not measure electrical stress or heat, but it provides essential structural and environmental context. RGB imaging can identify:
- Cracked or chipped insulators
- Surface contamination
- Missing or damaged hardware
- Corrosion
- Mechanical deformation
- Installation irregularities
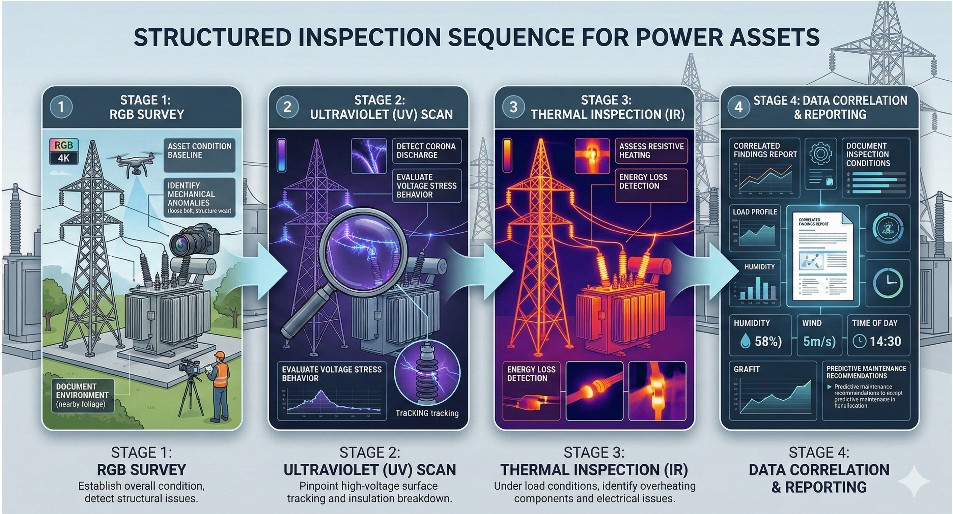
Recommended field workflow
Step 1
RGB survey to establish asset condition, identify mechanical anomalies, and document environment.
Step 2
Ultraviolet scan to detect corona discharge and evaluate voltage stress behavior.
Step 3
Thermal inspection under appropriate load conditions to assess resistive heating and energy loss.
Step 4
Correlation of findings and documentation of inspection conditions including load, humidity, wind, and time of day.
Data capture requirements
- Consistent distance, focus, zoom, and measurement scale
- Proper temperature range settings for thermal imaging
- Adequate UV sensitivity
- Recording of metadata including load level, humidity, wind conditions, ambient temperature, and time of day
Repeatability is essential for trending. Capturing consistent imagery under comparable conditions enables meaningful comparison over time.
Summary: complementary technologies across the failure curve
Ultraviolet and thermal imaging detect different physical mechanisms within high-voltage systems. Ultraviolet imaging reveals voltage-driven electric field stress and corona partial discharge. Thermal imaging reveals current-driven resistive heating and energy loss.
In certain scenarios, corona partial discharge activity may be visible before measurable temperature rise develops. In others, resistive heating may be the first observable indicator. Neither technology replaces the other. Together, and supported by RGB visual inspection, they provide a comprehensive view of asset condition across the electrical failure progression.
|
Parameter.
|
Ultraviolet (UV)
|
Thermal (Infrared)
|
RGB Visual
|
|---|---|---|---|
|
Governing phenomenon
|
Electric field ionization
|
Temperature rise
|
Reflected visible light
|
|
Detects
|
Corona and surface partial discharge
|
Resistive heating, overload
|
Physical condition
|
|
Primary driver
|
Voltage stress
|
Current flow
|
Visual observation
|
|
Load requirement
|
Not load-dependent
|
Requires sufficient load
|
Not load-dependent
|
|
Typical detection stage
|
Early to mid-stage
|
Mid to late-stage
|
Any stage (visual evidence only)
|
|
Influenced by humidity
|
Yes, can increase visibility
|
Minor effect
|
Minimal
|
|
Influenced by wind
|
Minimal
|
Yes, can cool components
|
Minimal
|
|
Solar influence
|
Not affected by solar radiation
|
Solar reflections possible
|
Dependent on lighting
|
|
Indicates energy loss
|
Minimal at early stage
|
Yes
|
No
|
|
Primary strength
|
Early detection of voltage stress
|
Quantifies heating
|
Context and documentation
|
|
Best used for
|
Field stress anomalies
|
Load-related deterioration
|
Mechanical and surface inspection
|
|
Complementary role
|
Reveals stress before heating
|
Confirms resistive damage
|
Provides physical context
|
Frequently asked questions
What does an infrared imaging camera detect in electrical inspection?
An infrared imaging camera detects temperature rise associated with current flow and resistive losses. It reveals the thermal consequence of electrical inefficiency rather than voltage stress itself.
Is an infrared detection camera the same as thermal imaging?
The phrase infrared detection camera is used here in the context of thermal imaging. The source describes thermal cameras as tools that detect emitted infrared radiation associated with surface temperature.
Why can UV imaging reveal issues before an infrared imaging camera?
Because UV imaging detects voltage-related discharge activity such as corona partial discharge, while thermal imaging depends on measurable heating. In some scenarios, voltage stress and corona activity are present before thermal rise develops.
Does one technology replaces the other?
No. Ultraviolet and thermal imaging do not compete. They reveal different physical mechanisms and are complementary across the failure curve.

Sheyna Reizes
VP Product at OFIL Systems Group
Product manager with extensive experience across multiple industries, specializing in B2B SaaS solutions and HW/SW integrated systems. Skilled in both inbound and outbound roles, leading product strategy and market expansion. Focused on driving product innovations and technology integration to increase market share and customer engagement.