Background
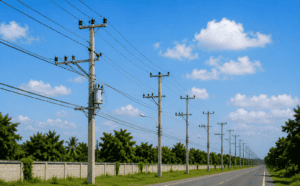
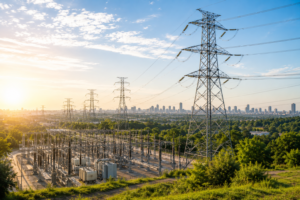
The City of Troy is a municipal electric utility serving a population of approximately 8,000 residents. The utility is responsible for maintaining more than 5,000 distribution assets, including poles, transformers, and associated equipment, as well as multiple substations across its service territory.
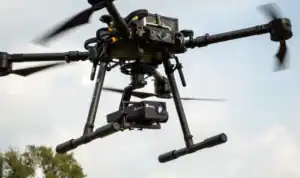
Over the past several years, the City of Troy has developed a highly structured and forward-leaning drone inspection program. Using advanced RGB and thermal sensors, the utility conducts annual inspections of its distribution network, capturing large volumes of visual and thermal imagery to identify developing faults, deterioration, and safety risks.
The Challenge
While the inspection program itself was mature, the way inspection data was handled had become a limiting factor. Images and videos collected during drone flights were stored across multiple shared drives and folders, making it difficult to:
- Associate imagery with the correct physical assets
- Review inspection findings consistently across the team
- Compare results year over year
- Quickly extract insights to support maintenance decisions or reporting
As inspection volumes increased, the lack of a centralized inspection data platform began to slow down post-processing, analysis, and decision-making.
The Turning Point
In 2025, Chase Collins, UAS Program Director for the City of Troy, initiated the move to Gridnostic as a centralized platform for managing and analyzing inspection data.
The Gridnostic Approach
Using Gridnostic, the City of Troy now uploads all RGB and thermal inspection imagery into a single cloud-based platform. Each image is automatically connected to its corresponding asset and displayed on a GIS-based map, providing immediate spatial and asset-level context.
Instead of performing time-consuming reviews in the field, Chase’s five-person inspection team focuses on fast, efficient data collection during flights. Detailed inspection and analysis are then carried out in the office.
Standardized Analysis and Severity Prioritization
Gridnostic provides structured inspection workflows aligned with EPRI-based guidelines and industry best practices. This allows the City of Troy to evaluate findings consistently and assign severity levels across the network.
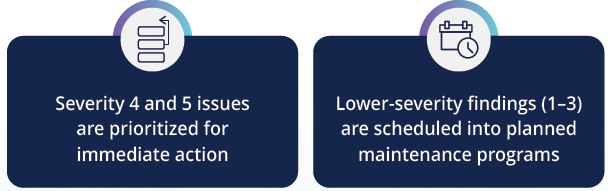
This structured approach helps ensure that resources are directed where they are needed most, while still maintaining long-term asset health.
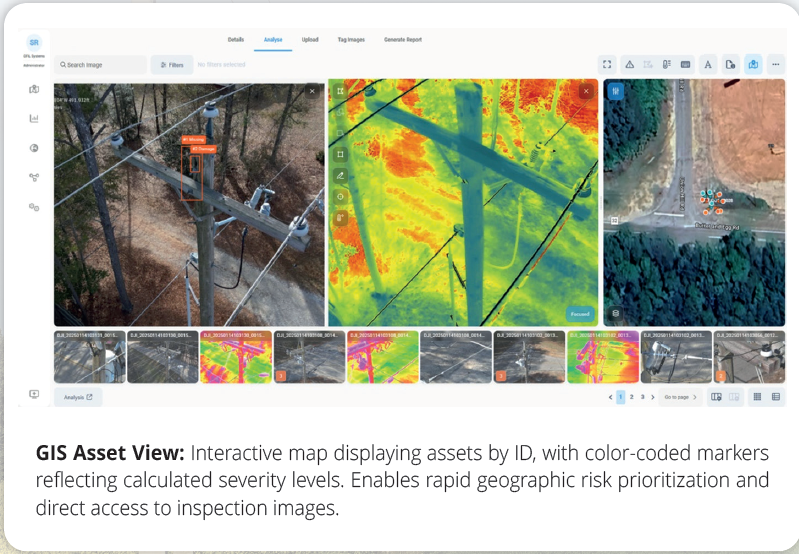
Multi-Sensor Analysis Screen
Side-by-side RGB and thermal inspection imagery within a structured evaluation interface. Supports consistent severity assessment and precise component-level analysis.
Network-Level Visibility
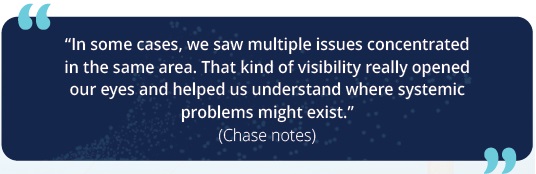
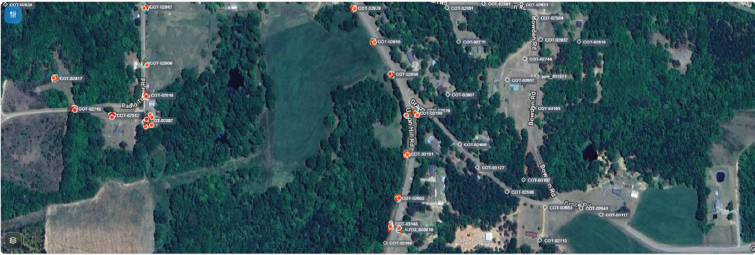
Beyond individual assets, Gridnostic dashboards give the utility a network-wide view of inspection results. Chase and his team use these dashboards to identify patterns and geographic clusters of issues.
GIS Asset View
Interactive map displaying assets by ID, with color-coded markers reflecting calculated severity levels. Enables rapid geographic risk prioritization and direct access to inspection images.
Documentation and Compliance Value
In one notable case, the City of Troy was able to support a FEMA reimbursement claim using inspection imagery. Historical images showed that a specific fault was not present during the annual inspection and was instead caused later by a weather-related event. This documentation played a key role in demonstrating the timeline and origin of the damage.
EPRI-Based Report Output
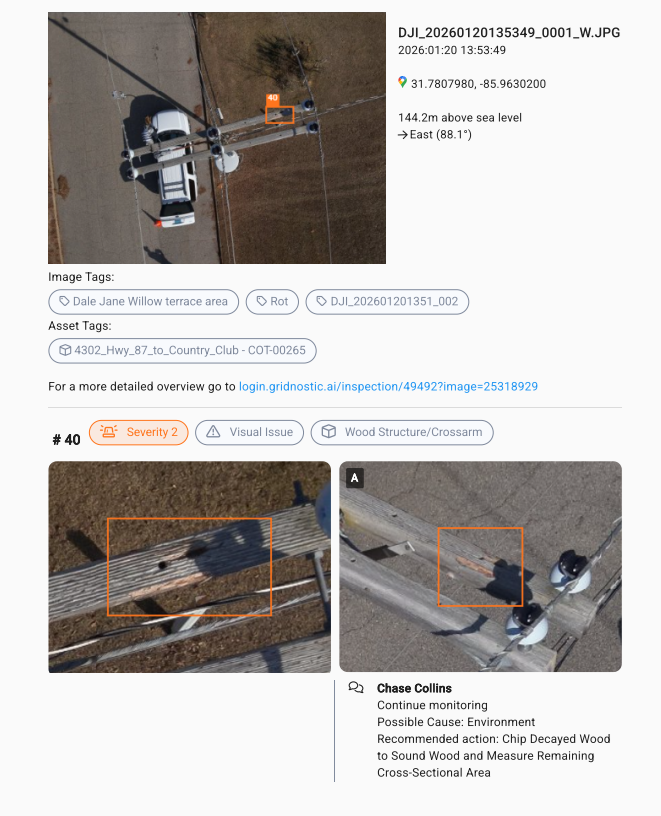
Automatically generated asset report including EPRI-aligned severity classification and maintenance recommendations. Converts inspection findings into standardized, decision-ready documentation.
Results
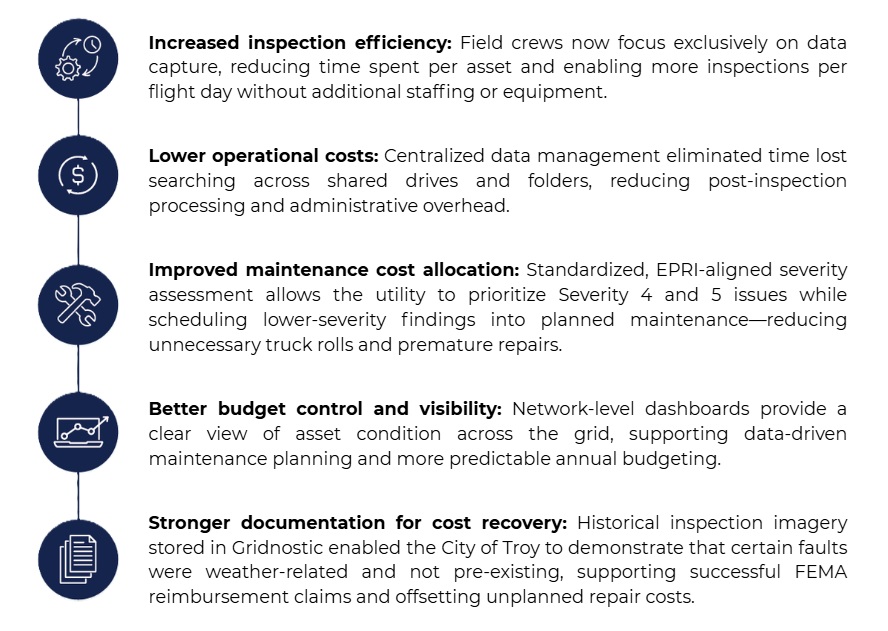
By adopting Gridnostic, the City of Troy achieved measurable operational and financial improvements without changing its existing inspection methodology:
For the City of Troy, Gridnostic has become a core component of turning inspection data into actionable, defensible maintenance decisions—without changing how inspections are performed in the field.