Why standardized data, geographic context, and consistent severity assessment are essential for smarter grid maintenance.
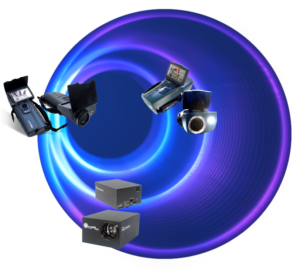
Every year, electric utilities conduct thousands of inspections across transmission lines, substations, and distribution networks. Drones, handheld cameras, and automated systems collect growing volumes of UV, infrared (IR), and high-resolution visual (RGB) imagery, revealing valuable information about electrical asset conditions.
Yet despite this wealth of information, a fundamental challenge remains: How much of today’s inspection data will still be useful when the same asset is inspected next year?
An inspection report may accurately document the condition of a component at a particular moment. However, when findings are stored in disconnected PDF reports, spreadsheets, image folders, and separate databases, comparing results over time becomes considerably more difficult.
The challenge is no longer simply collecting inspection data. It is transforming individual observations into structured, comparable, and continuously useful asset intelligence.
The Problem with Fragmented Inspection Data
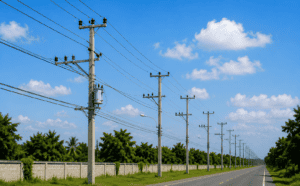
Consider a transmission line inspected annually using drone-mounted sensors.
During the first inspection, a UV camera detects corona activity near an insulator. The finding is documented in a report with an image, geographic coordinates, and an inspector’s comments.
A year later, another inspection identifies discharge activity at approximately the same location. This time, however, the data is collected using a different camera, processed by another service provider, and stored in a separate reporting system.
Although both inspections may be technically accurate, several questions arise:
- Are the findings associated with exactly the same component?
- Has the discharge activity changed, or were the inspection conditions different?
- Was the original defect repaired, monitored, or left untreated?
- Has the asset’s overall condition deteriorated?
- Should maintenance priority change based on the new findings?
Without consistent data structures and historical links between inspections, answering these questions may require significant manual investigation.
As inspection programs expand, this fragmentation becomes a barrier to efficient asset management.
Data Standardization: Creating a Common Language for Inspections
Standardization is often associated with file formats, but effective inspection data management involves much more than ensuring that different systems can open the same images or reports.
It requires consistent definitions, classifications, identifiers, and contextual information.
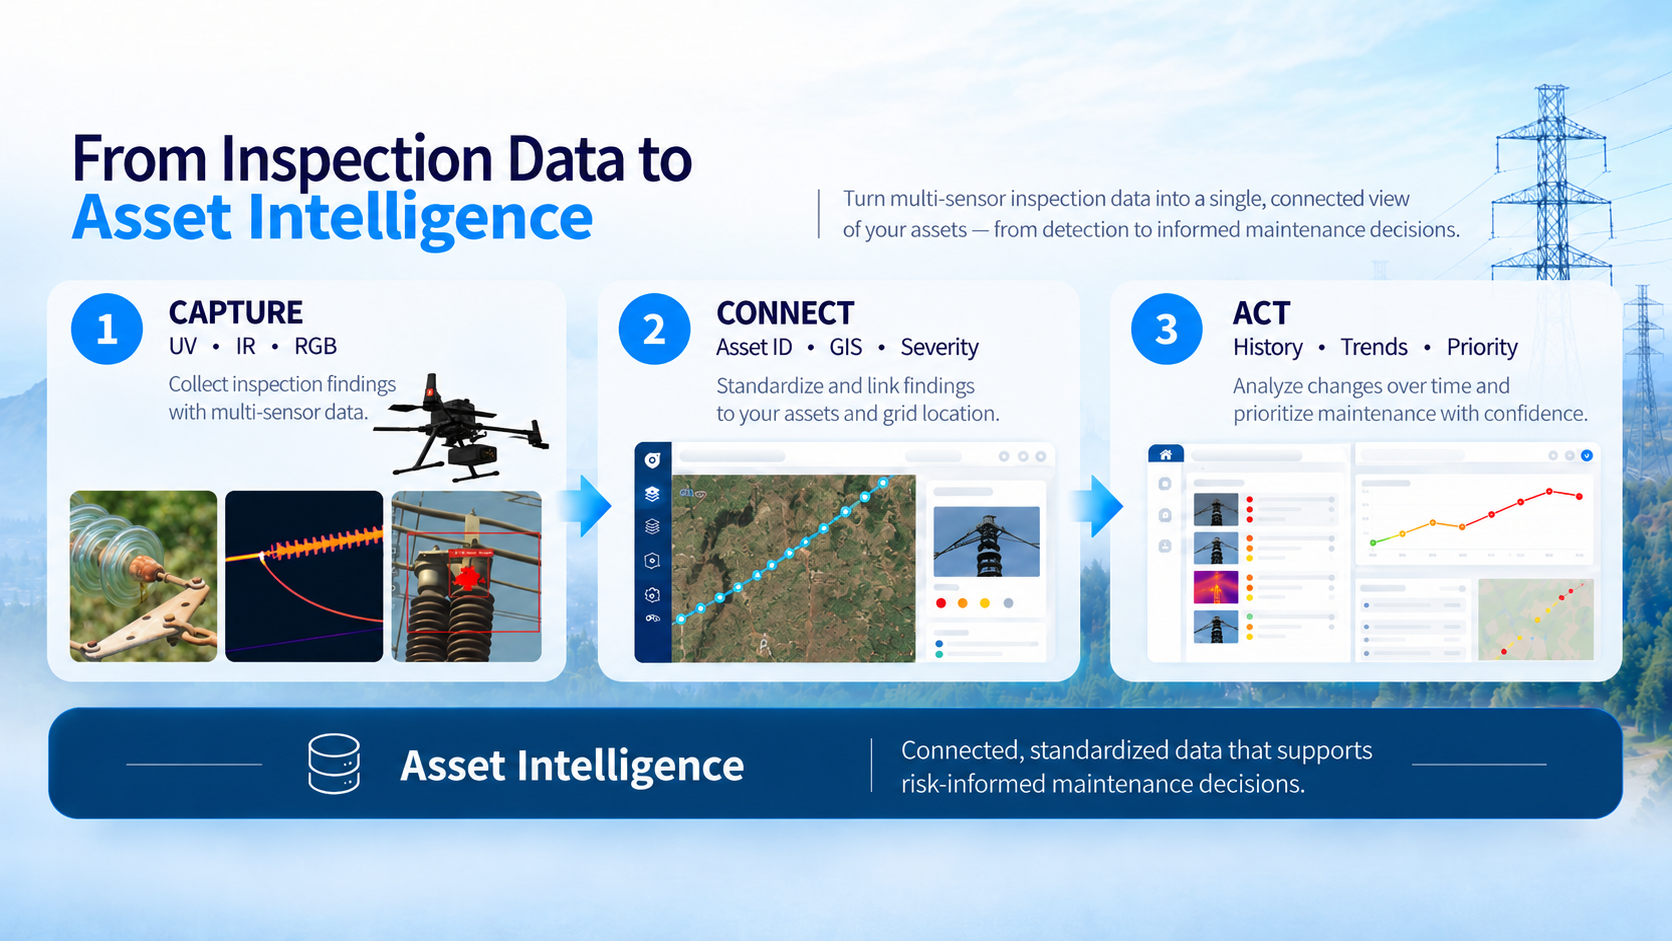
For example, every inspection finding should ideally include a common set of information:
Asset identification: A unique, persistent identifier linking the finding to a specific structure and component.
Geographic information: Accurate location data that allows findings to be associated with infrastructure assets and mapped within the electrical network.
Inspection details: Date, inspection method, sensor type, and relevant operating or environmental conditions.
Defect classification: Consistent terminology describing the detected anomaly, whether corona discharge, abnormal heating, corrosion, physical damage, or another condition.
Severity assessment: A structured evaluation of defect severity, supported by defined criteria rather than subjective descriptions alone.
Historical and maintenance information: Links to previous observations, corrective actions, and subsequent inspections.
When inspection findings are documented using consistent data structures, they become easier to compare, analyze, exchange, and retrieve.
This principle is reflected in industry standards such as IEEE 1808-2024, which addresses the collection and management of transmission line inspection and maintenance data.
The objective is not to make every inspection identical, but to ensure that its results can be understood and used consistently across different teams, technologies, and reporting periods.
Geographic Context: Connecting Findings to the Grid
Electrical infrastructure is geographically distributed, and location is fundamental to understanding asset conditions.
However, geographic coordinates alone do not necessarily provide sufficient information.
An inspection image may identify a defect near a transmission tower, but maintenance teams need to know which insulator, connection, or component is affected.
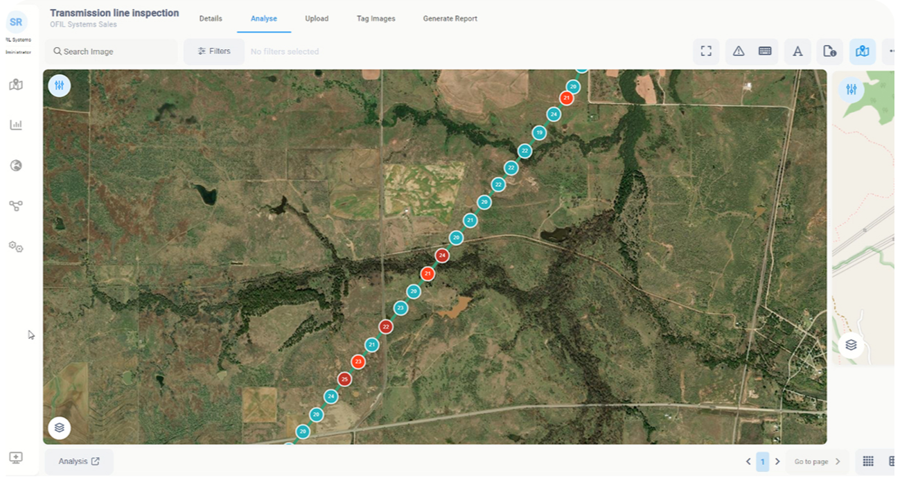
Linking inspection findings to Geographic Information Systems (GIS) and asset identifiers allows utilities to organize information around the actual infrastructure rather than individual image files.
Geospatial context can also help identify patterns that might otherwise remain unnoticed.
For example, repeated corona activity across several structures in a coastal region may indicate environmental influences such as salt contamination. Similarly, clusters of thermal anomalies along a particular feeder may warrant further investigation into operating conditions or equipment characteristics.
These patterns do not automatically establish a common cause, but they help engineers identify where more detailed investigation may be justified.
The value of geographic information lies not only in locating a defect, but in understanding where it occurs within the broader electrical network.
Severity Assessment: From Observations to Comparable Information
Inspection findings are not equally significant.
A visible anomaly may require immediate attention, while another finding may be suitable for continued observation. The challenge is applying consistent assessment criteria across different inspectors, technologies, and inspection campaigns.
Without a structured methodology, similar defects may receive different descriptions or maintenance recommendations depending on the inspector’s experience and judgment.
A standardized severity assessment framework helps reduce this inconsistency by establishing common criteria for evaluating findings.
Importantly, defect severity and maintenance priority are related but not identical.
Severity describes the condition or seriousness of an observed defect. Maintenance priority may also depend on asset criticality, network redundancy, operating conditions, environmental exposure, and the consequences of a potential failure.
For example, a moderate defect on a critical transmission asset may require greater attention than a more severe defect on equipment with limited operational impact.
Consistent severity assessment provides a foundation for comparing findings, while asset context supports risk-informed maintenance prioritization.
From Static PDFs to Living Asset Records
Traditional inspection reports remain valuable for documentation, communication, and regulatory purposes. However, a PDF typically represents a snapshot of equipment condition at a specific point in time.
The underlying structured inspection data can serve a broader purpose.
Rather than treating each inspection as an independent event, utilities can associate new findings with previous observations and maintenance activities to build a continuously updated record of each asset’s condition.
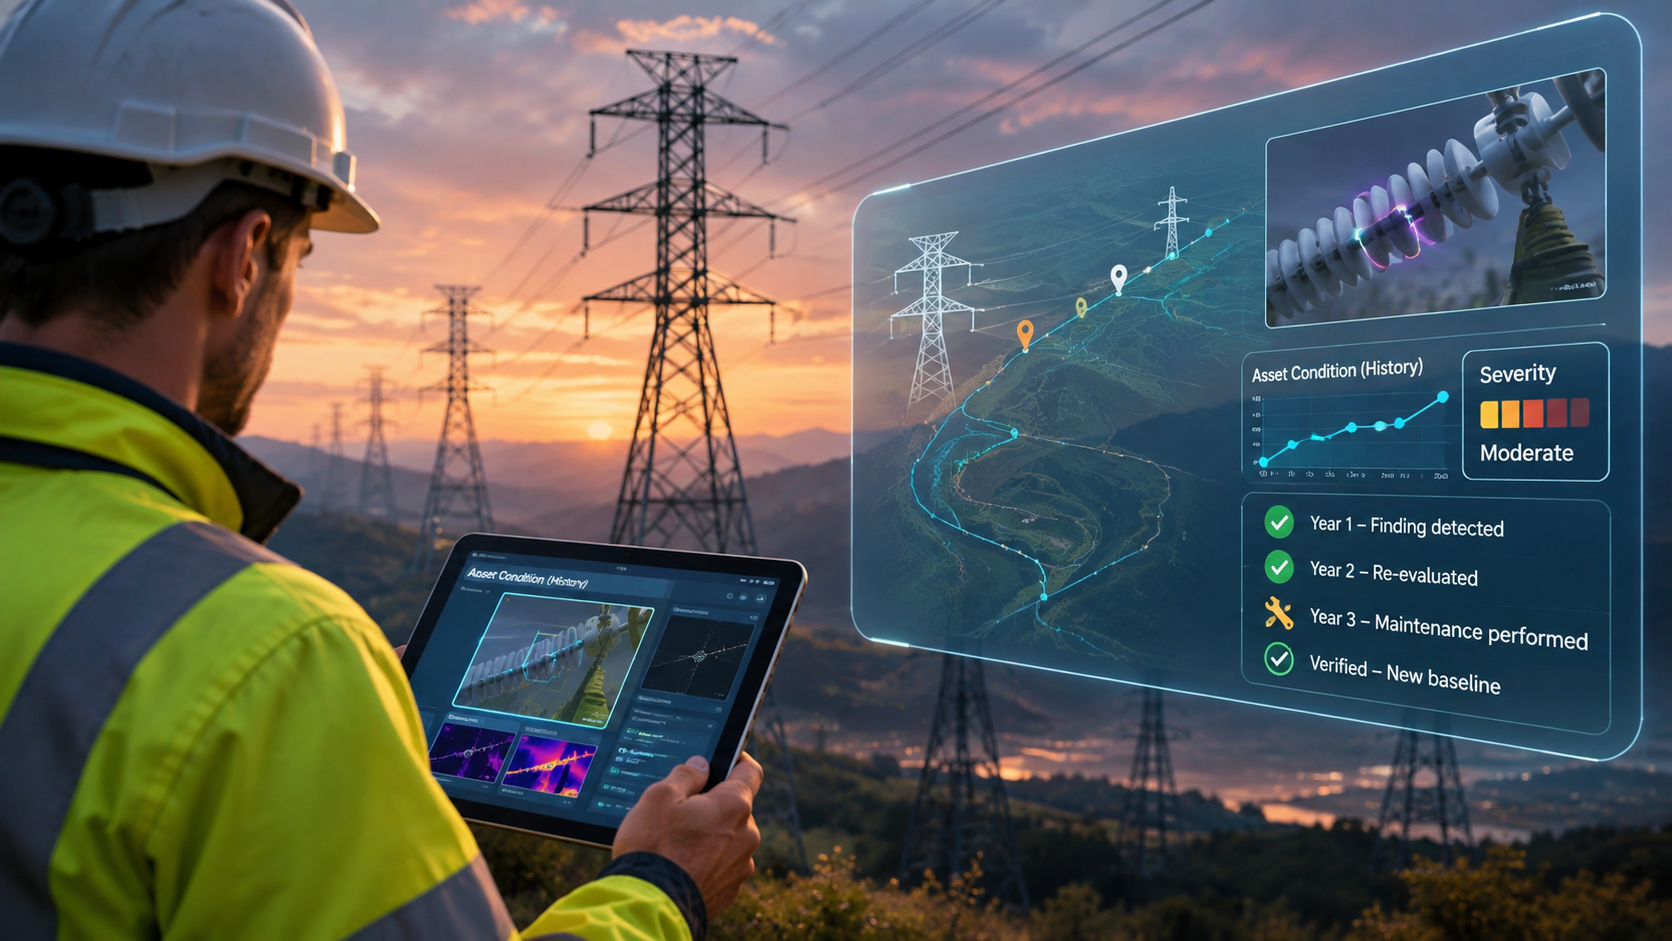
Consider an insulator inspected over several years:
Year 1: A UV inspection identifies localized corona activity. The finding is documented and classified for further monitoring.
Year 2: A subsequent inspection detects activity at the same location. After accounting for differences in inspection conditions, the new observation warrants additional evaluation.
Year 3: Maintenance is performed, followed by another inspection to verify the result and establish a new condition baseline.
n a conventional document-based workflow, these events might be recorded in three separate reports.
In an asset-centered approach, they form a connected history showing the original finding, subsequent observations, maintenance intervention, and verification.
This historical perspective allows engineers to investigate whether an anomaly is stable, developing, or resolved.
It also helps utilities evaluate maintenance effectiveness, identify recurring issues, and support more informed long-term planning.
A living asset record is therefore more than a digital archive. It is an evolving collection of inspection findings, assessments, and maintenance history associated with a specific piece of infrastructure.
Making Inspection Data Useful Beyond the Inspection Team
Standardized, historically connected inspection data can support multiple functions within a utility.
Maintenance teams gain access to previous findings and can plan more targeted inspections and corrective actions.
Asset managers can evaluate condition trends and compare maintenance needs across larger populations of equipment.
Engineering teams can investigate recurring defect patterns and examine potential relationships between equipment design, operating conditions, and observed deterioration.
Management can benefit from more consistent information to support maintenance budgets, investment planning, and risk-based prioritization.
The same data can also support advanced analytics and AI applications. However, the reliability of these applications depends heavily on the quality, consistency, and completeness of the underlying information.
AI cannot compensate for missing asset identities, inconsistent defect classifications, or inspection records that cannot be reliably connected over time.
As utilities adopt more automated inspection technologies, standardized data management becomes increasingly important.
Bringing It Together with Gridnostic™
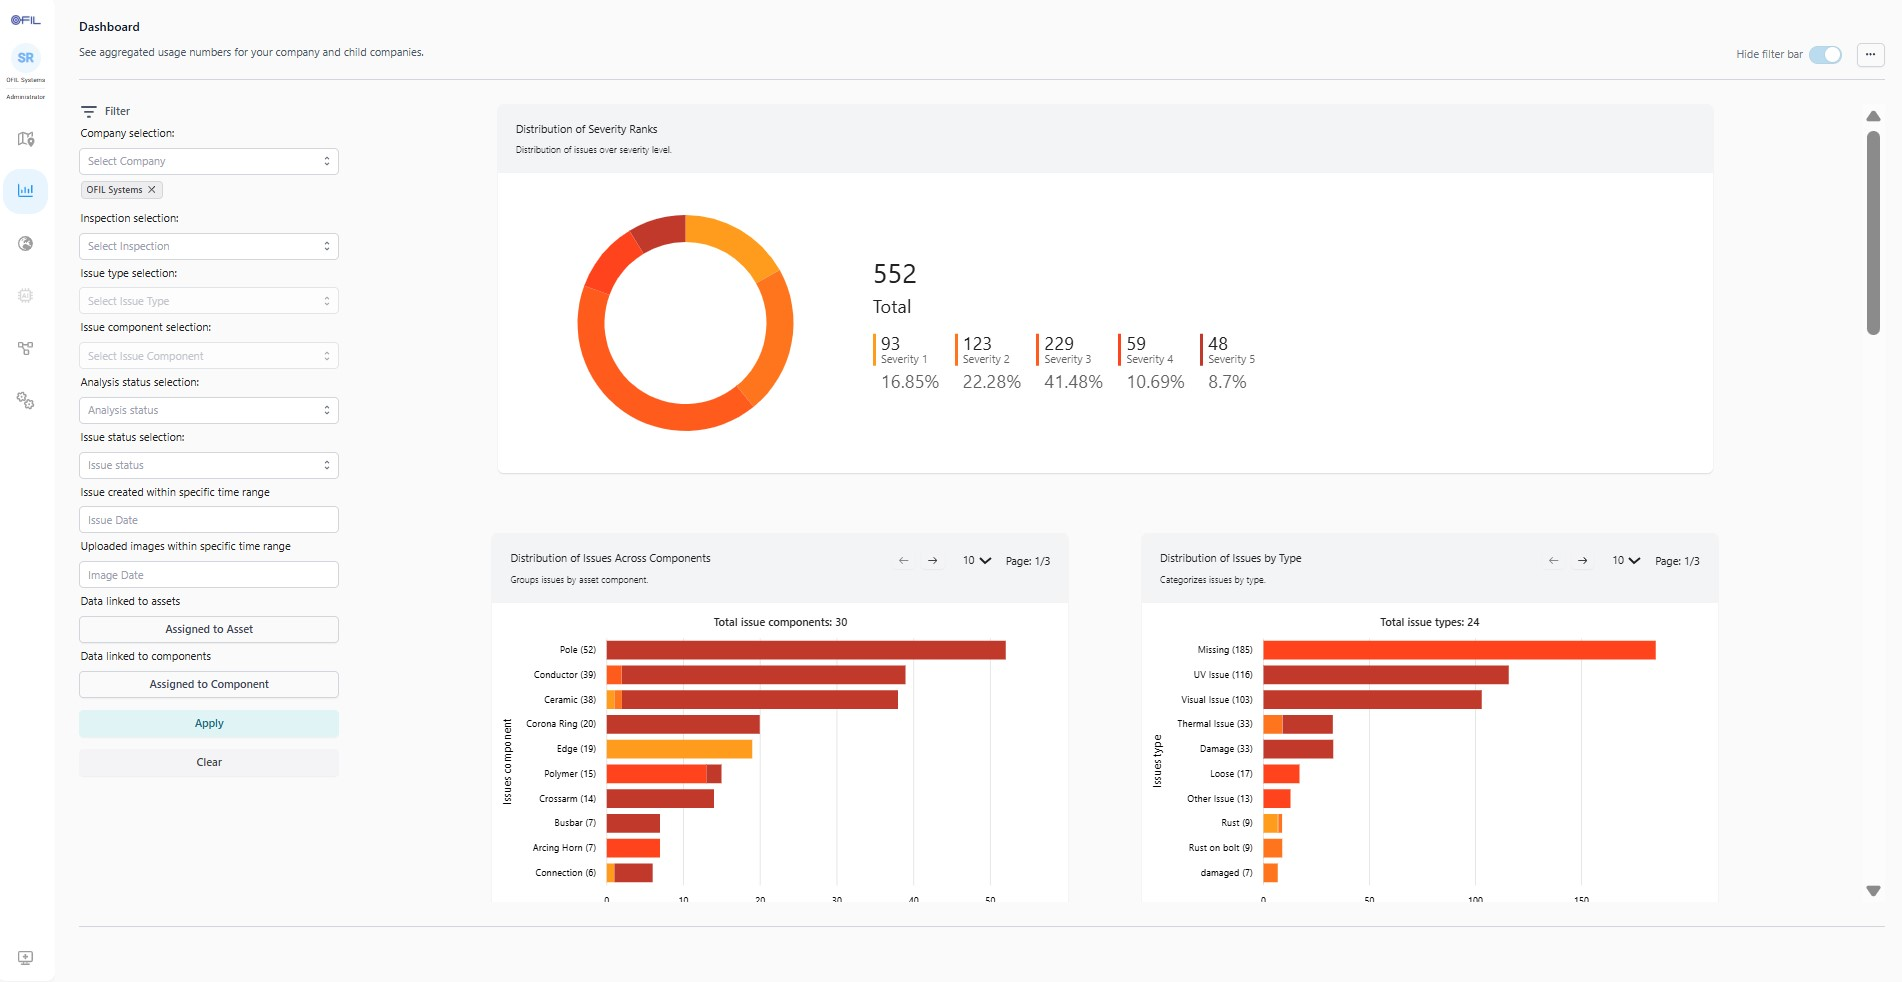
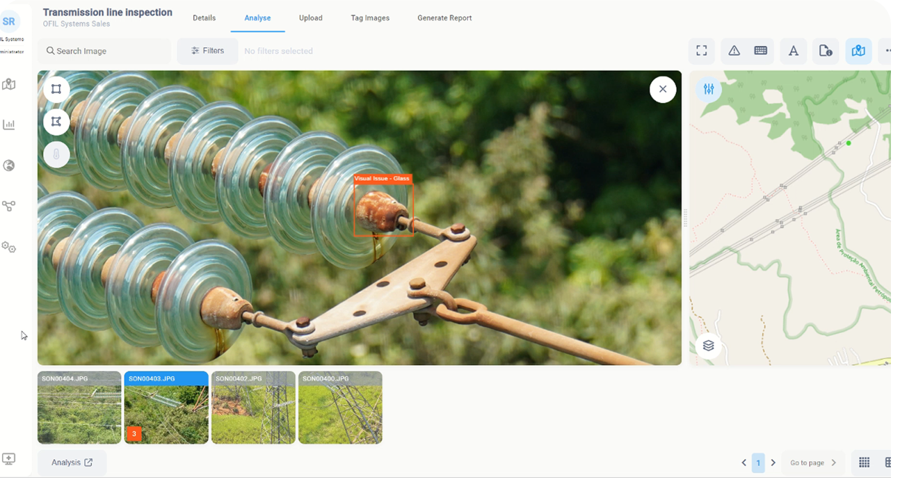
OFIL’s Gridnostic™ platform supports this transition from isolated inspection reports to structured, asset-centered intelligence. The platform brings together UV, IR, and RGB inspection data, enabling each technology’s findings to be analyzed independently or in combination. Through GIS-based asset mapping, historical inspection records, AI-assisted analysis, and structured severity assessments based on EPRI research and guidelines, Gridnostic™ helps utilities organize findings, evaluate asset conditions, and prioritize maintenance activities. The platform also supports automated reporting and the ability to track findings across inspection cycles. In addition, Gridnostic™ now enables users to upload and view LiDAR files, adding three-dimensional spatial context to the inspection environment. By connecting multi-sensor observations with geographic and historical asset information, Gridnostic™ helps make inspection data more accessible, comparable, and actionable.
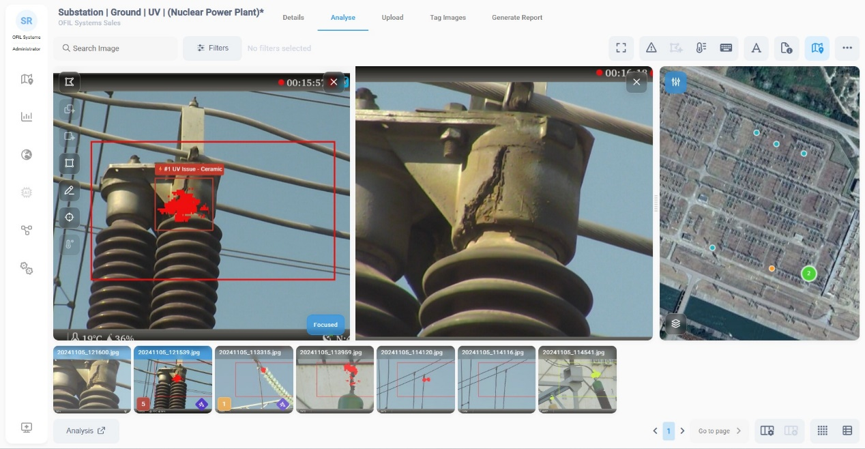
UV and RGB images shown side by side in Gridnostic reveal corona partial discharge at a substation bushing seal, along with the visible damage caused by the broken seal. This is a severe defect, as moisture ingress can compromise insulation and may lead to flashover.
The Future of Inspection Is Connected Information
The next major advancement in utility inspection may not come from collecting more images, but from making better use of the information already being collected.
Cameras and sensors reveal the condition of electrical equipment at the time of inspection. Standardized data structures, geographic context, and consistent severity assessments make those observations easier to interpret and compare.
When connected to historical records and maintenance activities, individual findings become part of a much more valuable information resource.
For utilities managing aging infrastructure, growing networks, and increasing reliability requirements, this transition offers a stronger foundation for proactive maintenance and long-term asset management.
An inspection tells us what was observed. A connected asset history helps us understand what has changed — and what deserves attention next.